What the Navy Can Teach Us About Revenue Growth
• Learn why your % revenue growth says very little about your business' health
• Why you should add contribution per FTE growth % to your monthly dashboard
Revenue growth is great. Hurray! Senior leadership teams understandably celebrate it because it feels like obvious proof of progress.
But if your revenue growth is at the expense of your margin, you're adding headaches to your day faster than you're adding dollars to your P&L. And leaving yourself with fewer resources to untangle the mess left behind in the long term.
What the navy can teach us about revenue growth
Growing up, my Dad was a doctor in the Navy, and is still a keen boatsman today. He taught me about a phenomenon called "cavitation".
Essentially, trying to make a boat faster by spinning the propeller at extreme speeds, without the right design, creates vacuum bubbles that eat away at the metal of the propeller itself. Short term, the boat might speed up, but the engine is literally destroying its own hardware in the process.
It's a bit like what happens when businesses put short term revenue growth ahead of the long term health of the business. And it's why revenue growth % in isolation is not a particularly useful metric; it says very little about the quality, or the efficiency of that growth.
You can grow revenue by:
• cutting prices
• spending aggressively on acquisition
• taking on low-margin work
All of these inflate the top line at the expense of the long term health of the business.
The revenue growth % vs contribution per FTE growth % comparison
A far more useful overlay on top of revenue growth % is contribution per full time employee (FTE).
I use FTE here because for the overwhelming majority of businesses, salaries are the single largest operating cost. If you run a logistics company, you might overlay contribution per route. If you're in SaaS, contribution per licence.
The principle is the same: if you want to know whether your growth is efficient, measure it against the resource you're spending the most money on.
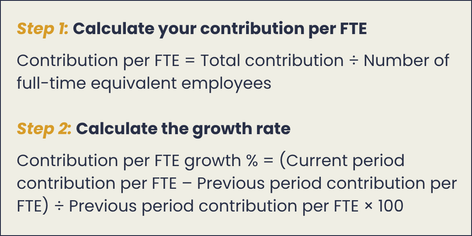
How to calculate contribution per FTE growth %
If revenue % is growing, but contribution per FTE growth % is flat or declining, at best you're paying too much for your growth.
At worst, it's actually eroding enterprise value and making your business run less efficiently.
What are the numbers telling you?
In boating, you don't avoid cavitation by going slower. You avoid it by designing a propeller that converts power into forward motion without destroying itself in the process.
As the enterprise guardian of efficiency, it's the CFO's job to architect the systems that ensure every dollar of revenue earned creates enduring, scalable enterprise value.
Contribution per FTE is one way to tell whether topline growth is generating that value, or simply generating more activity, at the expense of the structural integrity of the business.
I highly recommend you add it to your results dashboard.
Is it time to change the conversation in your organisation from simply growth, to the quality of your growth?
I'd love to hear your thoughts.

Author: Alena Bennett
Alena works with leaders and their teams to connect technical and leadership skills so they can deliver to deadline without killing their people.


This is the trusted guide for CFOs to lead with IMPACT and create VALUE.

It's time for women in finance to find power in their purpose!